Case study · Personal concept · 2025
Digital Instrument Cluster for a REEV
A range-extended electric car runs on two energy sources, and its driver looks at the cluster for less than half a second at a time. The layout has to explain both energy sources in that glance and still keep speed and safety first.
- Type
- Personal concept
- Role
- Research, layout, visual design
- Display
- 1920 × 480 ultra-wide cluster
- Year
- 2025
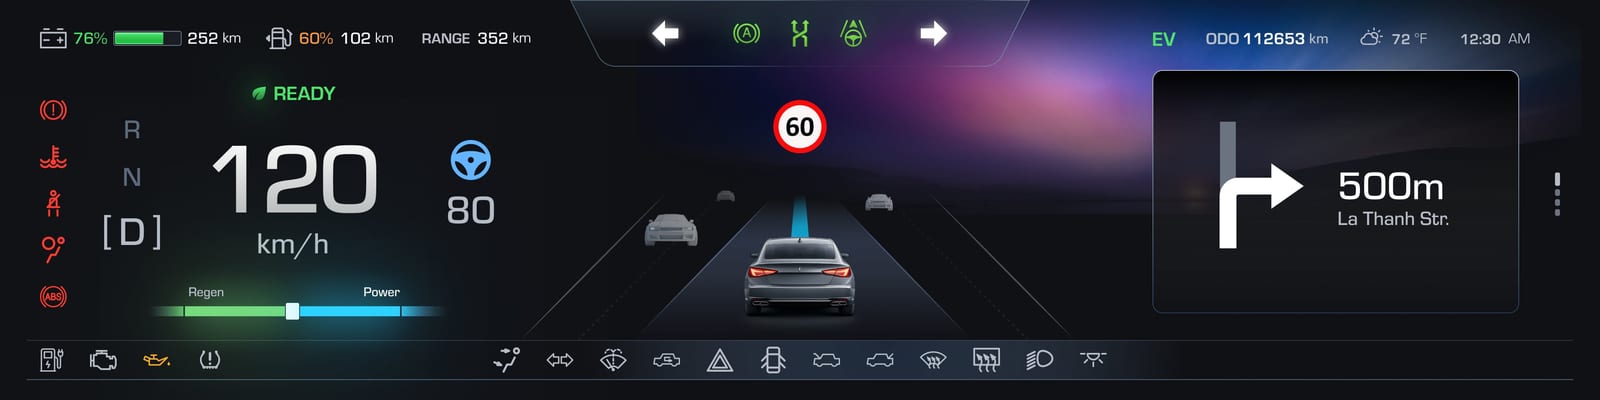
Two energy sources, one glance
A REEV drives on electricity. The engine never turns the wheels — it only runs a generator that refills the battery. So the driver has two tanks to watch, and a range that depends on both.
- electric battery state
- fuel generator status
- total driving range
- driving awareness
- safety warnings
- ADAS visualization
Balancing information density and readability on an ultra-wide display.
What the driver can actually take in
I looked at how REEVs already on the road show energy — BMW i3 REx and Mazda MX-30 R-EV — and at the human factors that limit any cluster.
Glance time
Drivers typically look at the cluster for less than half a second. Anything that needs reading, not recognising, is too slow.
Peripheral vision
Drivers notice warning lights without looking straight at them. Where a warning sits matters as much as what it looks like.
Color perception
Drivers recognise a color faster than an icon shape. Color has to carry meaning, so it cannot be used as decoration.
Seen in existing REEVs
Dual energy indicators, a total range estimate, and a generator activity status.
The display itself
A wide field of view, high brightness contrast, and a need to stay readable at night. Information has to be grouped across the width.
What it adds up to
Energy visualization is not a side panel here. For a REEV it becomes a critical part of the driving interface.
Drivers need a clear mental model of energy flow — and critical warnings belong where peripheral vision catches them.
Four principles
Every layout option after this was judged against these four, in this order.
Driving awareness first
Speed and the road environment stay the primary focus.
Energy transparency
The driver always knows how much energy is available.
Clear hierarchy
What matters most stands out immediately.
Minimal cognitive load
Everything is understandable in one quick glance.
Five zones across 1920 pixels
The ultra-wide format gives a lot of horizontal space, and space invites clutter. I split the strip into five zones, each with one job, so nothing competes with speed in the middle of the driver’s view.
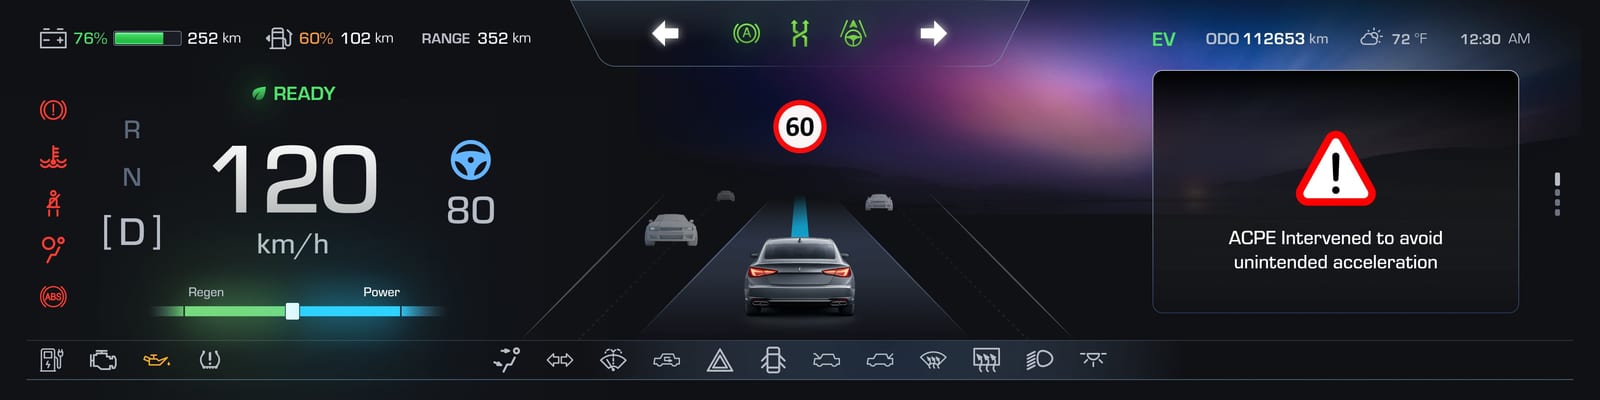
Select a zone on the display or in the list.
- 1
Energy bar
Battery, fuel and total range, side by side along the top edge.
- 2
Speed block
Speed as the visual anchor, with gear, set speed and the regen/power meter.
- 3
ADAS visualization
The car, its lane and the vehicles around it, dead centre.
- 4
Context widget
One card that changes with the situation: media, a call, a turn.
- 5
Telltale strip
Vehicle warnings and system status, ordered by priority.
Warnings live where the eye catches them
Telltales are sorted by how dangerous they are, and position follows priority. Critical warnings sit on the far left, where the driver’s peripheral vision already rests, and only red is ever used there.
Critical
Brake failure, seatbelt, battery fault. Drawn in red.
Left edgeWarnings
Low fuel, TPMS, charging. Amber when active.
Right after criticalSystem status
Lights, wipers, doors. Grey, so they never compete.
Toward the rightCounts are the telltale icons laid out in each tier of the final screen.
Signal colors
Automotive convention#FF3B30#FFB020#4CE36B#64B5FFEnergy colors
Two sources#2ED2FF#FF9A3DNeutrals: ground to text
0F11151A1E246C7380B7BDC6FFFFFFOne typeface, sized by importance
Eurostile throughout: squared, wide and technical, so digits stay distinct at a glance. Size does the ranking — the speed is more than twice the size of anything else on the display.
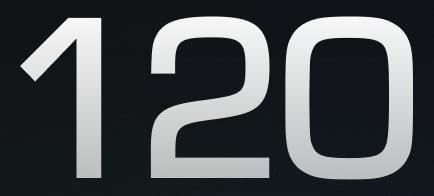 Primary. The speed value.
![[D]](img/ipc/type-48.jpg) Driving state. Selected gear, set speed, the next turn distance.
Driving state. Selected gear, set speed, the next turn distance. Unit under the speed.
 Inactive gears, dimmed so the selected one reads first.
 Status. Ready, EV mode, street names.
 Energy values and the odometer.
 Supporting. Units, clock, temperature.
 Labels on the regen/power meter.
One slot, six situations
Only zone 4 changes. The rest of the cluster stays exactly where the driver learned it, so a new situation never moves speed, energy or warnings.
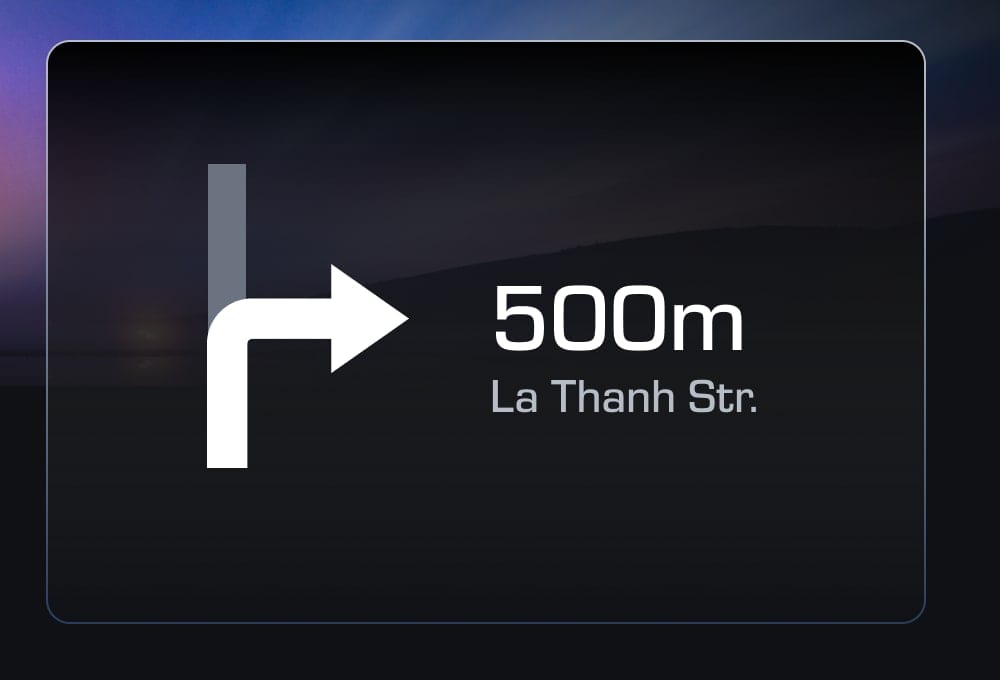
Turn by turn. The next manoeuvre and its distance, large enough to read without looking away from the road for long.
Decisions and trade-offs
Five decisions shaped the final layout. Each one gave something up.
- 01
Speed as the visual anchor
WhySpeed is the most critical driving information. It has to register within a quick glance.
- 02
Centralized ADAS view
WhyThe centre is dedicated to the driving environment, so the driver can see what the car perceives.
- 03
Energy transparency for REEV
WhyTwo energy sources need clear feedback on what is left: battery level, fuel level and total range, along the top.
- 04
Peripheral warning detection
WhyCritical telltales always sit on the left. A consistent place means faster recognition in peripheral vision.
- 05
Structured information hierarchy
WhyFive zones with one job each. A clear hierarchy reduces cognitive load while driving.
- Challenge
- 1920×480 can show a large amount of information.
- Decision
- Limit what is visible and prioritise readability.
- Result
- More negative space, faster glance reading.
- Challenge
- The ADAS view needs significant screen space.
- Decision
- Give it the centre, with speed anchored beside it.
- Result
- Speed and environment both stay in view.
- Challenge
- A REEV has a complex energy system.
- Decision
- Show battery, fuel and total range, not technical metrics.
- Result
- Energy availability is understood quickly.
- Challenge
- Too many telltales hide the ones that matter.
- Decision
- Limit visible icons and rank them by priority.
- Result
- Critical warnings stay clearly visible.
Back to all projects